Whereas most of the projects featured here were actual software development efforts, the wireframes on this page are more conceptual—potential product ideas I was pitching within the company. Specifically, I was asking the question, what unique features might differentiate an e-reader designed specifically for use in secondary schools? Such an e-reader would naturally many of the same features and advantages that characterize general use e-readers, such as easy access to word reference books, built-in note taking, and search. But how could an e-reader for secondary schools specifically help students develop the ability to read complex text independently, a focus shift at the heart of the Common Core ELA standards?
I used these wireframes to explore the following ideas:
- Tracking reading assignments
- Pointing out key academic vocabulary words, and offering specialized reference works to help students learn how to understand and use those words (conventional dictionaries and thesauruses are not effective for this purpose)
- Enabling students to flag words and passages in the text that they are having trouble understanding; aggregate this data into reports for the teacher to understand where self-monitored comprehension lags
- Enabling teachers to highlight and annotate particular passages, and make the annotations available to students on the page as they are reading (a qualitatively different experience from getting a page of notes)
- Enabling teachers to insert comprehension questions into passages, to be asked and answered while students are reading (again, qualitatively different from current approaches)
- Tracking how much time students are spending on the reading and how much of it they are doing, and report this to teachers (Not foolproof, but a vast improvement on the status quo, or relying on quizzes, etc.; could theoretically be combined with facial recognition and/or eye-tracking to provide more accurate measurements of time spent reading)
- Enabling students to share their notes and/or questions with study group, class, and teacher

One fundamental change relative to conventional e-readers would be to orient the reading experience around assignments rather than around entire works.

Another idea is to provide a very simple mechanism for a student to indicate that she was having difficulty understanding what is going on. Here, the student has pressed the “I’m Confused” button, and is prompted to identify the particular word or phrase that is the source of the difficulty.
The teacher could look at this confusion data for an individual student, but at least as interestingly, it could also be aggregated across an entire class, to paint a broader picture of where students are struggling with comprehension.
A deliberately subtle aspect of the design is that key academic vocabulary (so-called “tier 2 words”) appear with faint green underlining. I wouldn’t want to distract the reader, but I would want to alert her to the fact that this is an important word that she will encounter often in her academic reading. So, if she is unfamiliar with the way the word is being used in this text, it would be worth looking it up. Links could be provided to a reference work which talks about the word and the various ways that it is used in academic English. (Ordinary dictionaries are a notoriously poor tool for learning these sorts of words.)

Here, the teacher is looking at a page from the reading, with overlaid “confusion” data for the entire class. Individual words that students flagged are marked with circles, with the diameter proportional to the number of students marking the word. Phrases or sentences that students flagged are highlighted, with the intensity of the highlighting proportional to the number of students marking the word.
The right panel is in “time” mode, so it is showing a chart which displays how much time each student spent reading this section of the assignment. The teacher can use either the graph or the dropdown menu to drill down on a particular student, to focus on that student’s specific markup of the text (e.g. words that gave the student difficulty).
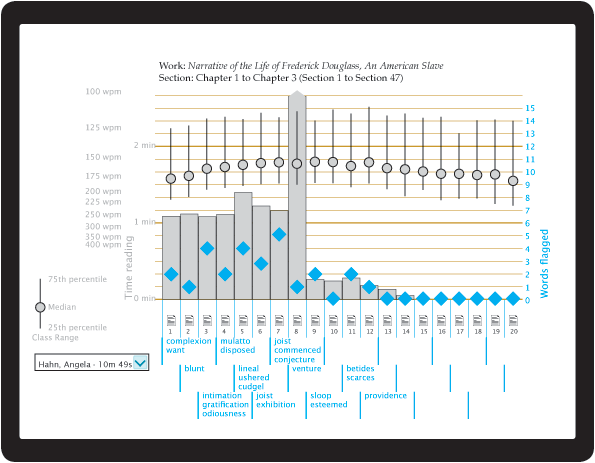
This screen presents a data visualization of one student’s reading patterns, for the assignment as a whole. Each gray bar represents the number of minutes spent on a particular page of the reading assignment, while the whisker chart shows the class median, 25th percentile, and 75th percentile. We can see that Angela sped (or skimmed) through the first 8 pages; she was easily in the bottom quarter of the class for time on this task. Then on page 8 she was off the chart, perhaps because she found that page especially difficult or engrossing, or perhaps because she got distracted and put down her device. Then she spent just a few seconds on each of the next five pages, and didn’t make it to the final pages of the assignment at all.
The blue diamonds indicate how many words she flagged on each page, and up to three such words per page are shown below the graph. Of course, these flagged words could also be used in student-facing contexts, for example to generate customized word study work.
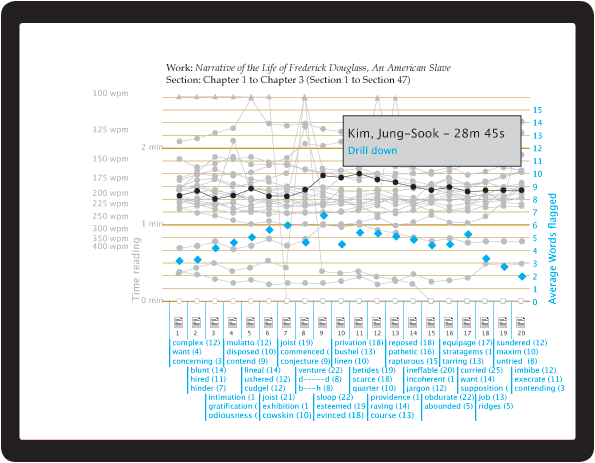
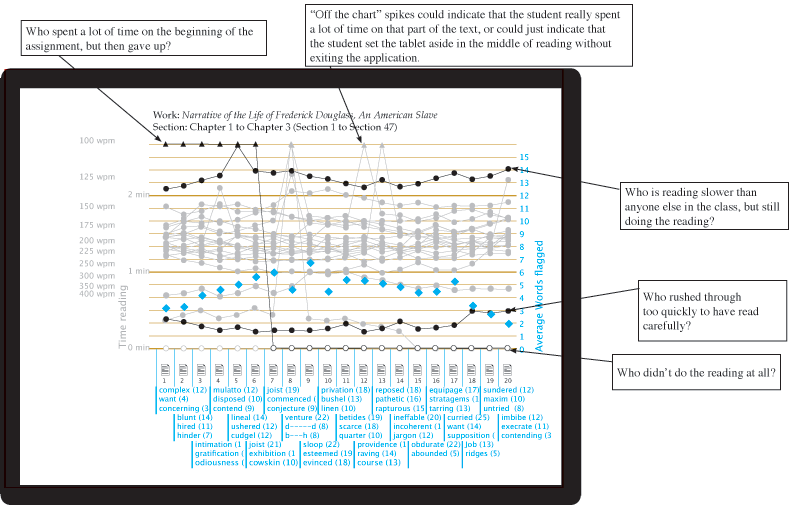
This is a similar chart for the entire class, with the bars replaced by connected line graphs, one for each student. The teacher could tap a line or point on the graph to display the name of the corresponding student and highlight his portion of the graph. In the center, the graphs can be expected to all run together, but that is also the part where it would typically be least interesting to drill down on individual students. The more interesting lines are really the outliers.
The blue diamonds here indicate the average number of words flagged per page, rather than data for individual students. Similarly, the words displayed at the below the chart are the most frequently flagged words for each page of the assignment.
The annotations on this final screen shot call out several interesting patterns that might appear in student reading data displayed in this manner.