ARIS (Assessment Reporting and Innovation system) was a web-based educational dashboard system built for the NYC department of education. It extracted student data from a variety of legacy systems and pipelines, including data pertaining to attendance, assessment, enrollment, and grades, and presented it to teachers and parents via a number of different reports. I was the UX design lead for all of these reports, and wrote the main functional specification for all of them. My responsibilities included conceptualizing the various reports, defining the data elements and associated business logic, and defining all of the interactions, including global navigation, parameter selection, the creation of student groups, and column sorting.
I have included here an example of an interesting data display widget that I designed in response to customer requirements, along with an example of a report in which it was used.
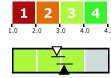 The upper part of the image was used as a key / column header; the lower part represents one student’s state summative test performance.
The student’s performance level (here, 3 of 4) is indicated by the fact that three of the four boxes are colored in, and also by the color that has been used.The black upward pointer tells us where in the performance level the student placed. We can see that this student scored just barely high enough to place into this level. The horizontal bar emanating from the pointer shows the associated standard error of measurement—in other words, the range within which the student’s score could be expected to fall if the student were to take many different forms of the test.
The white downward pointer (with its associated horizontal bar) does the same thing for the student’s performance on the equivalent test the previous year. Here we see a student who has advanced from a “high 2” to a “low 3”. By comparing the overlap between the two bars, we can see that it is difficult to determine with any confidence whether this was a material improvement, or whether the different in the scores is just a matter of “noise” attributable to measurement error.
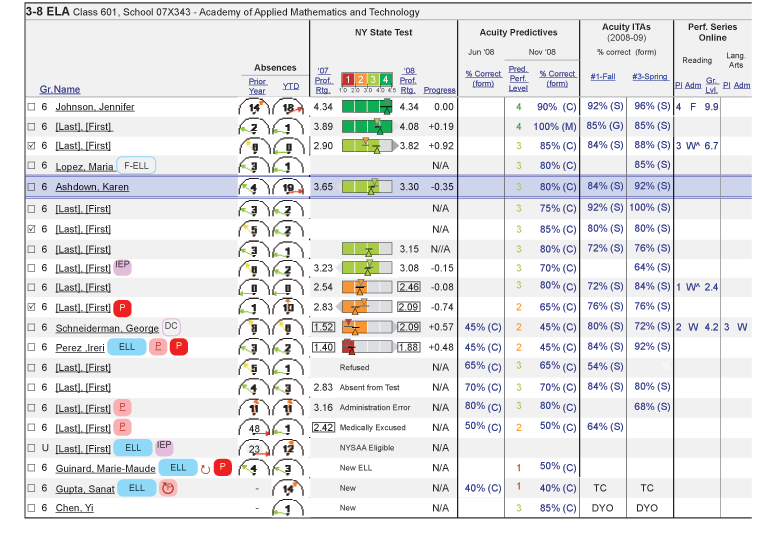
Variations on this widget were used on many “list of student” reports, including the one shown below.