Beacon tests were made up of new questions that had been specifically written to the higher demands of the Common Core Standards; since they were new, there was limited baseline performance data. Furthermore, every district created its own assessment blueprints based on the scope and sequence of its particular curriculum, so each district had its own unique assessments. These factors prevented us from implementing a traditional cut score setting process, which meant, in effect, that school districts were left to set their own cut scores on a raw score basis. (A cut score is the minimum score required to place into a particular performance band on a test.)
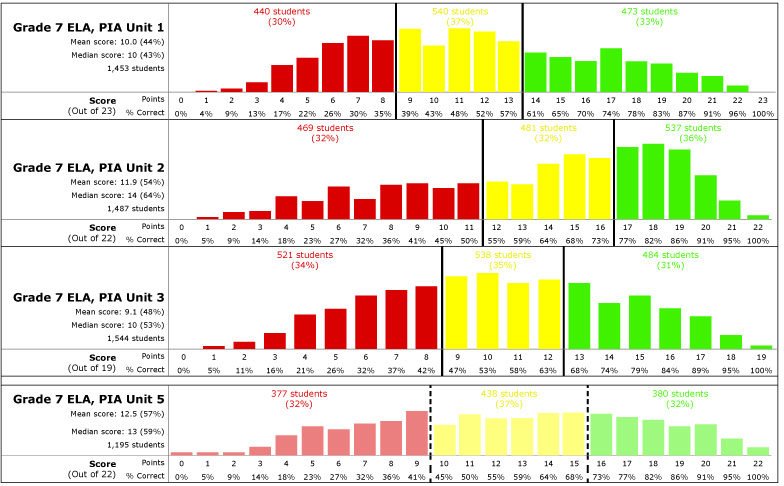
I wanted to create tools to help district administrators with the cut score setting process, and began with some initial conceptual wireframing. Here, we see raw score distribution for each of several tests in a sequence, and can observe that they had quite different shapes. We can also see that the district opted for a considerably lower “yellow” cut score on the unit 1 test than on the unit 2 test (39% vs. 55%), although in both cases this resulted in similar a similar proportion of students placing into the lowest band (30% vs. 32%). The process of creating this wireframe–and drawing the graphs using real data–helped me to to both think through and articulate a few issues. One issue, common to non-continuous data sets, is that a conventional histogram could be misleading because of “bucketing”. Consider histograms bucketed using the intervals 0-10%, 10%-20%, etc. Depending on the precise number of points possible on the test, some intervals will be associated with more possible scores than other intervals, which may produce “lumpiness” in the histogram that is purely a display artifact, with no significance in the underlying data set. This led me to create a separate bar for each possible score. At the same time, I wanted charts to facilitate comparisons between tests which might have had quite different possible scores from one another, which led to the variable width bars (and variable spacing between bars) shown here.
The main idea here was that the bottom graph represented the most recent test in the series, for which cut scores had not yet been finalized, and the administrator would be able to experiment with different possible cut scores to see the impact upon student classification. As it turned out, we did not have sufficient development capacity to build a tool like this into the product, but the wireframing helped to inform my development of a spreadsheet-based tool instead, which I conceived and built myself in Google Sheets.
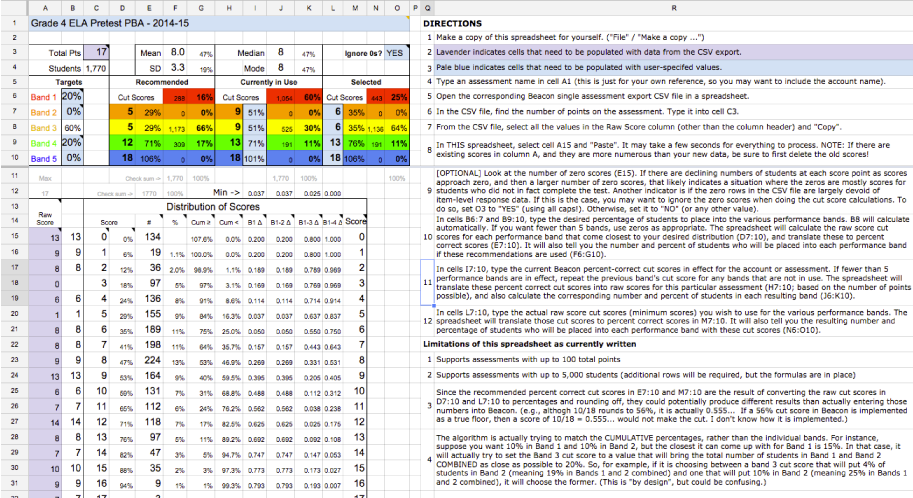
The tool took as input raw score data that could be copied and pasted from an existing Beacon export file, along with target distributions (i.e., the approximate percentage of students that the district thought should be placed into each performance band). The tool then recommended appropriate cut scores, and also allowed the user to see the distributions that would result from alternative choices. Account managers were able to use this tool to work with district administrators to help them select cut scores appropriate to their tests and students.
A tricky thing here is that while districts typically wanted to see performance distributions on their Beacon formative assessments that were roughly in line with their end-of-year high-stakes summative tests, this was at a time when most states were in the process of transitioning to new Common Core aligned summative tests, and didn’t really know what results to expect. It was universally understood that the Common Core cut scores would be significantly more rigorous than most legacy state tests (although there was also enormous variability amongst the states in where they had set their existing cut scores), meaning that there would be a lot more students scoring in lower levels and a lot fewer students in higher levels. But how many more, and how many fewer, was unknown. One reasonable basis on which to make an estimate was the NAEP (the National Assessment of Educational Progress), since the Common Core assessment consortia had indicated that their cut scores would be in line with the NAEP’s. This was not immediately useful, however, since NAEP results are generally only reported at the state level, not the district level, and there is profound district-to-district variation in most states.
To fill in this gap, I used spreadsheets to create a simple statistical model to estimate a district’s likely performance on upcoming Common Core tests. By comparing performance level distributions across different tests, it was possible to model relationships amongst them, and thereby use data from one test come up with rough estimates for how a district is likely to do on a different test.

For example, the spreadsheet at right shows that on California’s pre-2015 state test in math (the CST), 32.8% of California students were classified as “Advanced”, whereas only 6% of California students scored as “Advanced” on the NAEP. Across California, only 17% of students who scored “Advanced” on the CST earned that same distinction on the NAEP, whereas 74% scored “Proficient”, and 9% as “Basic”. Applying these same distributions to individual districts in California allowed for the creation of a crude estimate for how each district might expect to perform on Common Core tests, which provided at least a reasonable starting point for setting Beacon cut scores. (The example shown in this screen shot was actually a test case for the model, since Los Angeles USD is one of a small number of districts participating in a Department of Education pilot of reporting NAEP results at the district level.)
In addition to their use by account managers, these tools also allowed me to revisit our set of default Beacon cut scores (which many districts did not change), and to come up with new values that were both more appropriate to the difficulty of the content and much better justified to customers.