And here is a histogram representing the distribution of the number of monsters that had to be killed in order to acquire all three types of gems, produced with the following code:
import matplotlib.pyplot as plt
%matplotlib inline
plt.hist(monsterCount,bins=maxMonsterCount-1)
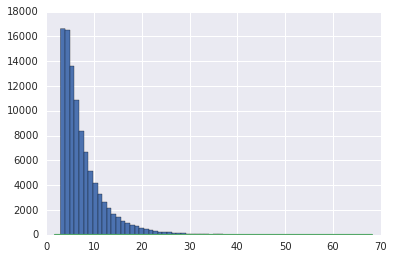
Note that this is for a different run of the code than the sample output I showed in the previous post. In this particular 100,000 trial run, there was one trial where it was necessary to kill 67 monsters in order to acquire all three gem types!
Also, copying the image produced a .png file with partial transparency, which has resulted in black-on-gray numbers here that aren’t very legible. Sorry about that. I think there are mechanisms for displaying Python output graphs in a browser window without just copying and pasting images, but I haven’t figured them out yet.